
Oliver Glasner has already made history with Nottingham Forest as deal confirmed to become Vitor Pereira's successor.
Brendan McGilligan
Oliver Glasner has already made history with Nottingham Forest as deal confirmed to become Vitor Pereira's successor.
Brendan McGilligan
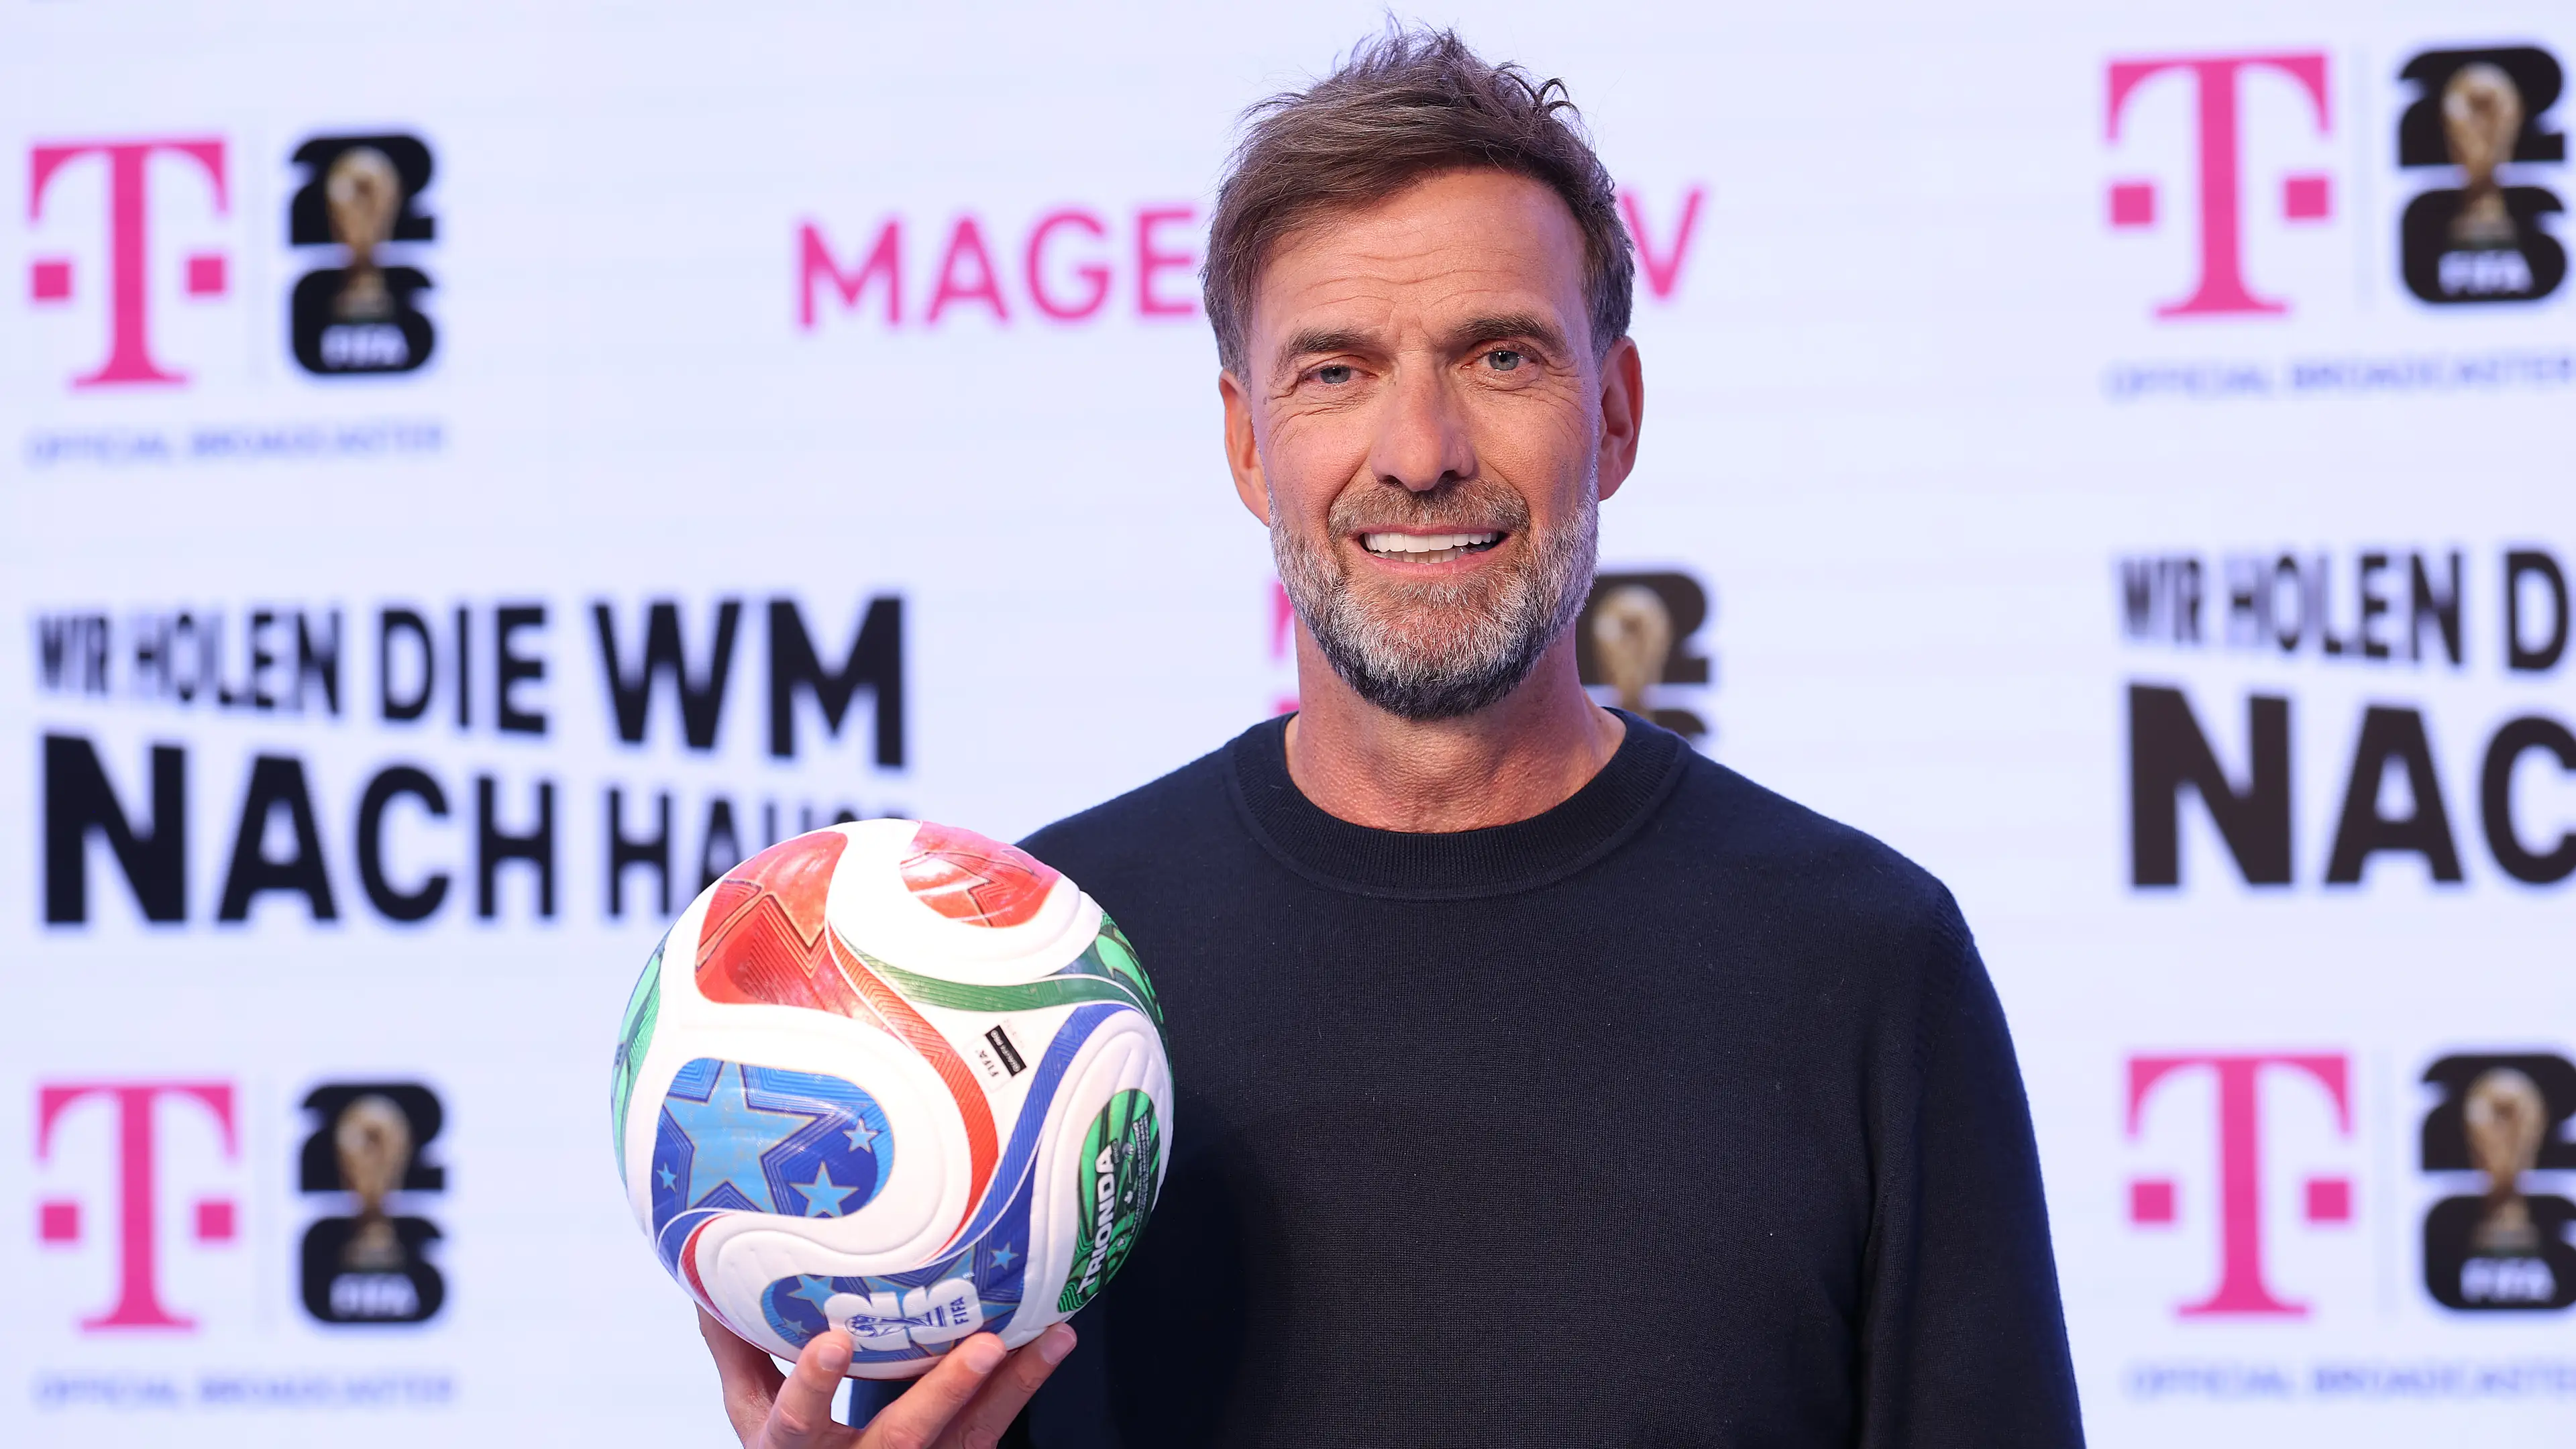
Jurgen Klopp has confirmed 'talks' are ongoing with Germany explaining what needs to happen to succeed Julian Nagelsmann.
Brendan McGilligan

Argentina have set a World Cup record as they beat Cape Verde in round of 32.
Brendan McGilligan

FIFA have finally confirmed when the kick-off of the England and Mexico World Cup clash will happen.
Brendan McGilligan