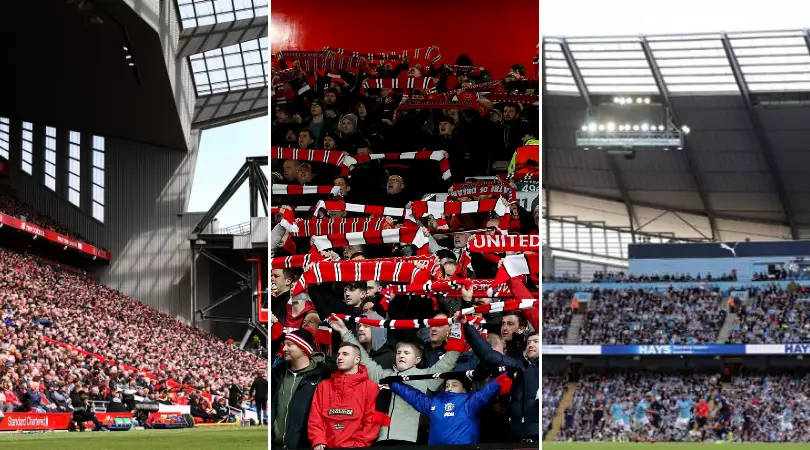

West Ham United's London Stadium is the most full ground in the Premier League this evening according to a study, with Newcastle United's St James' Park right at the opposite end of the table.
TransferMarkt have collated all the important data, which shows that the London Stadium has a capacity percentage of 99.9% after totalling an average attendance of 59,916 this campaign.
Chelsea, Leicester and Arsenal are joint second on 99.3%, with Norwich in fifth spot after filling 99.2% of their stadium.
Advert
Manchester City are regularly ridiculed with the 'Emptihad' jokes from rival fans about their attendances but the numbers here tell a completely different story.
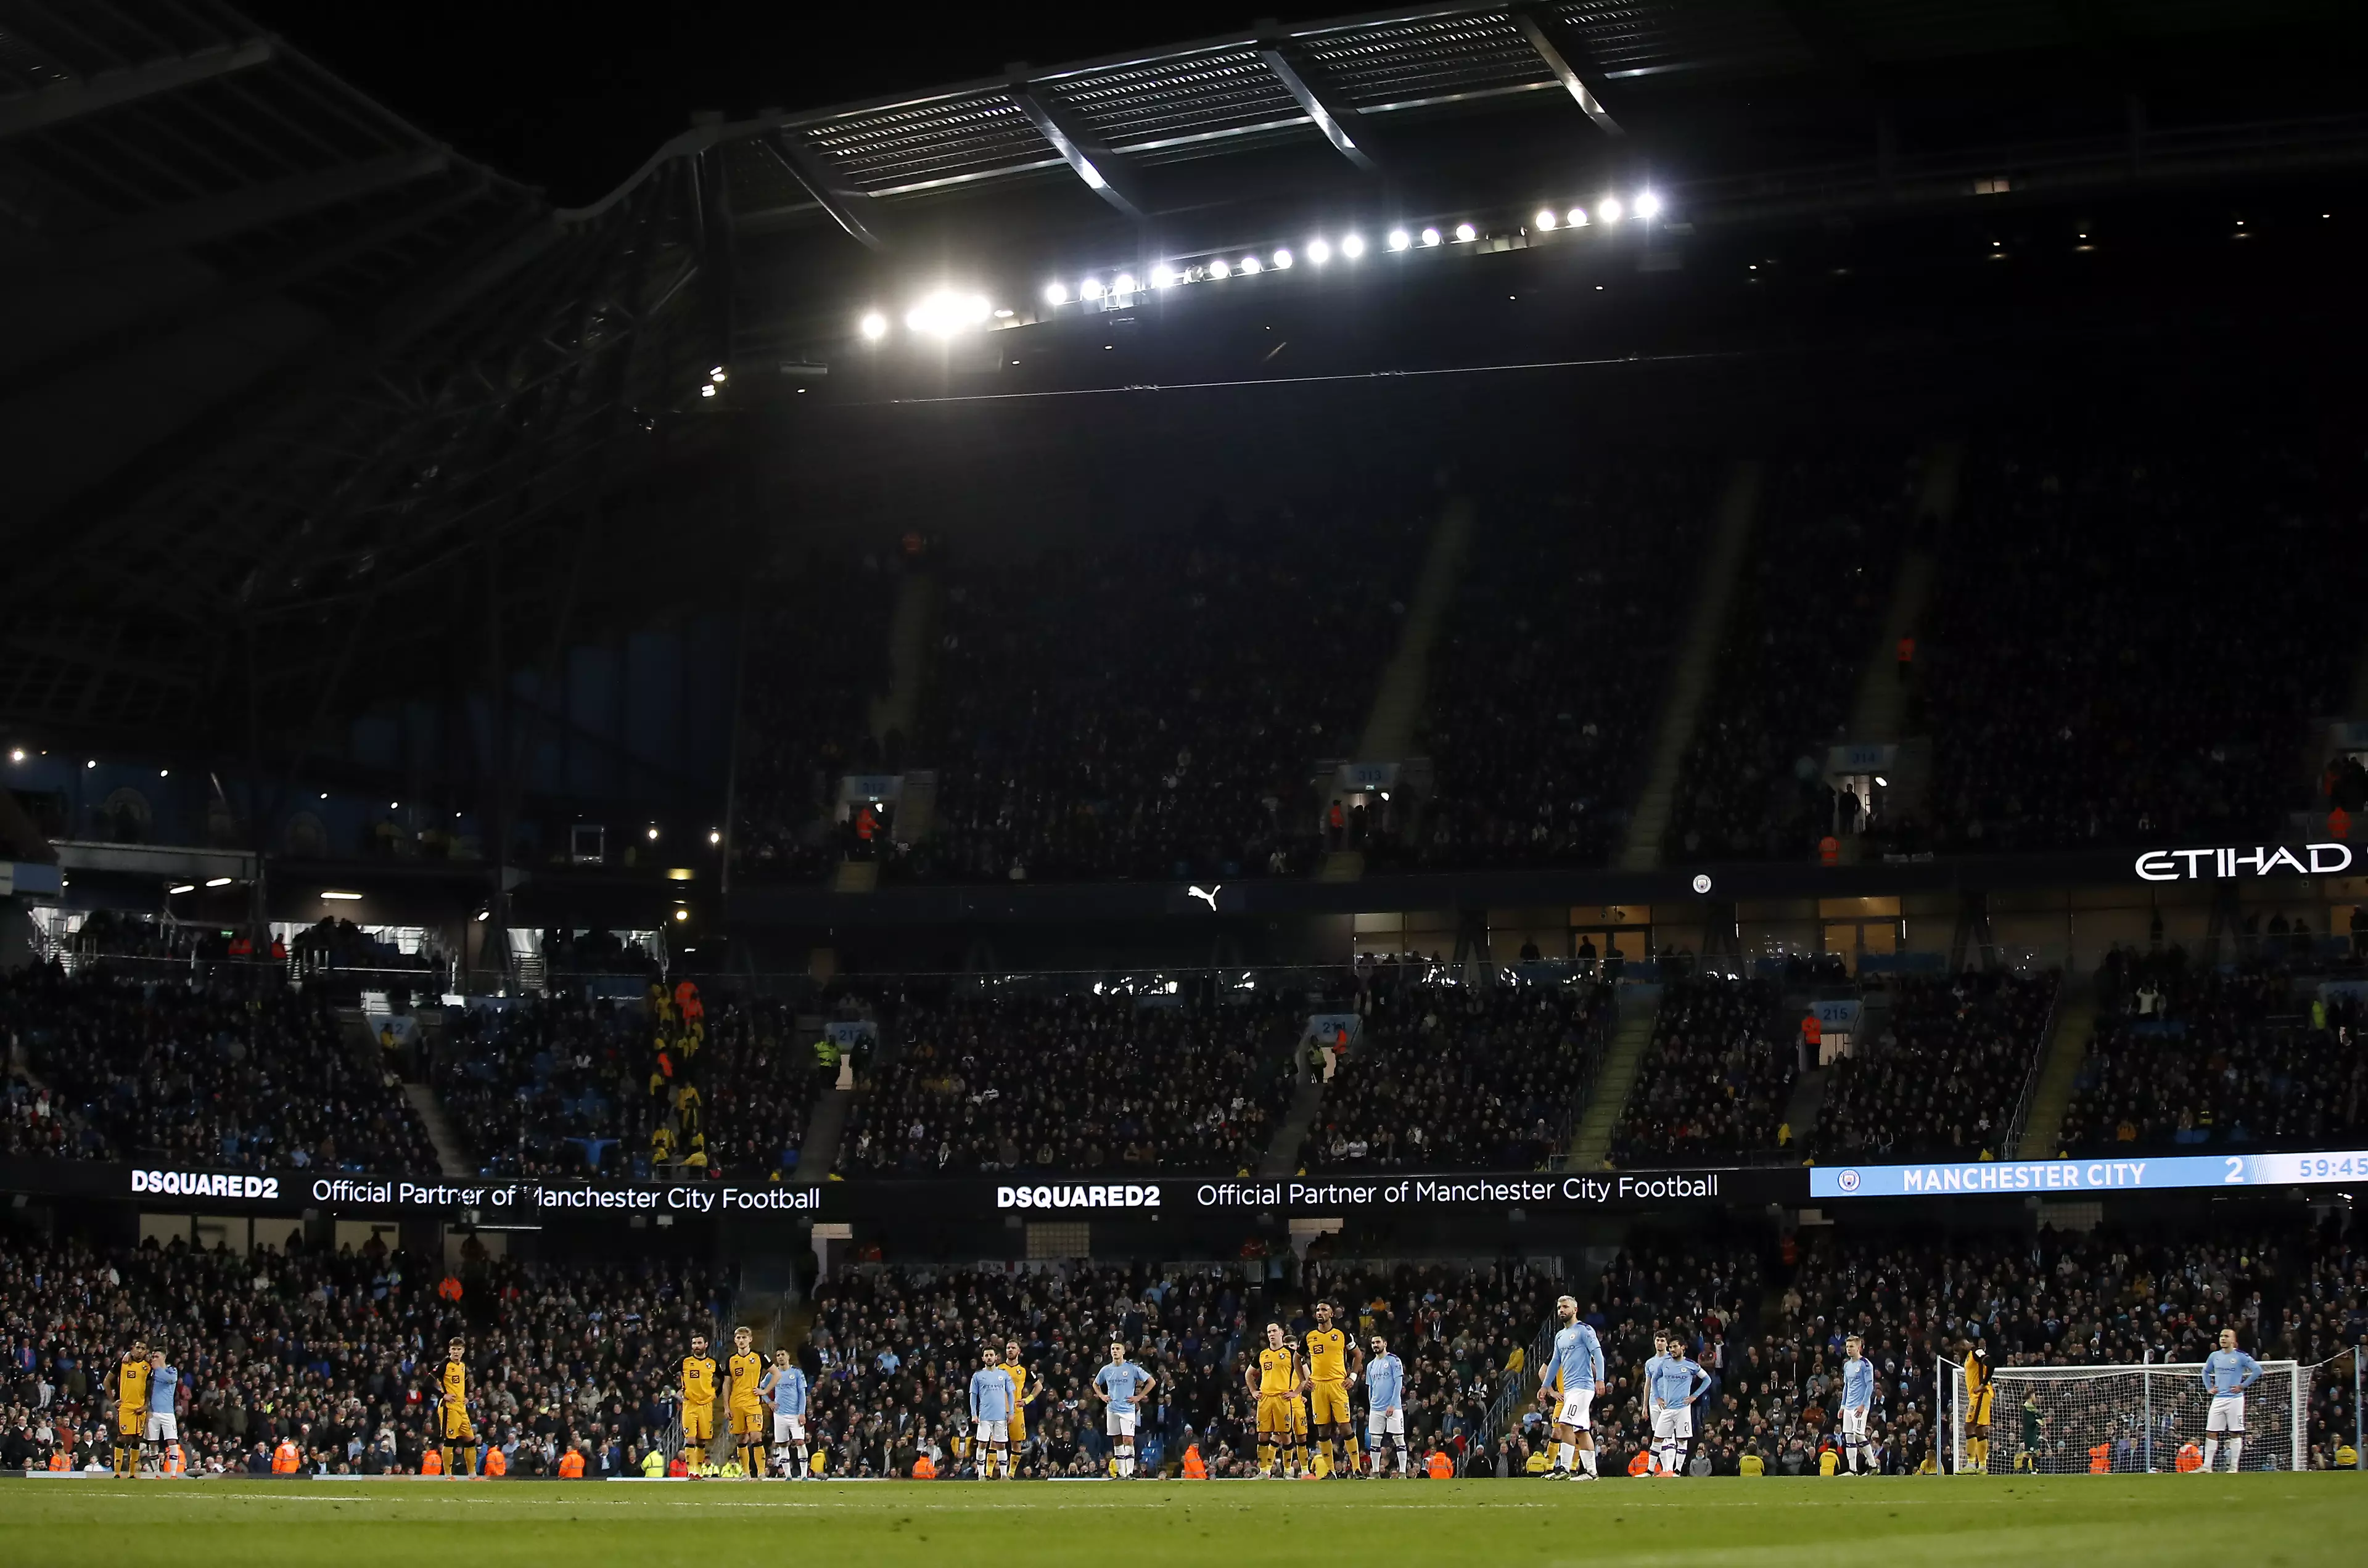
City are in eighth, ahead of 9th placed Liverpool and 12th placed Manchester United, having averaged 54,386 as a home crowd this term - giving them a capacity percentage of 98.9%.
At the very bottom of the pile is Newcastle but it's not so much of a surprise given the supporters' well-documented resentment towards owner Mike Ashley.
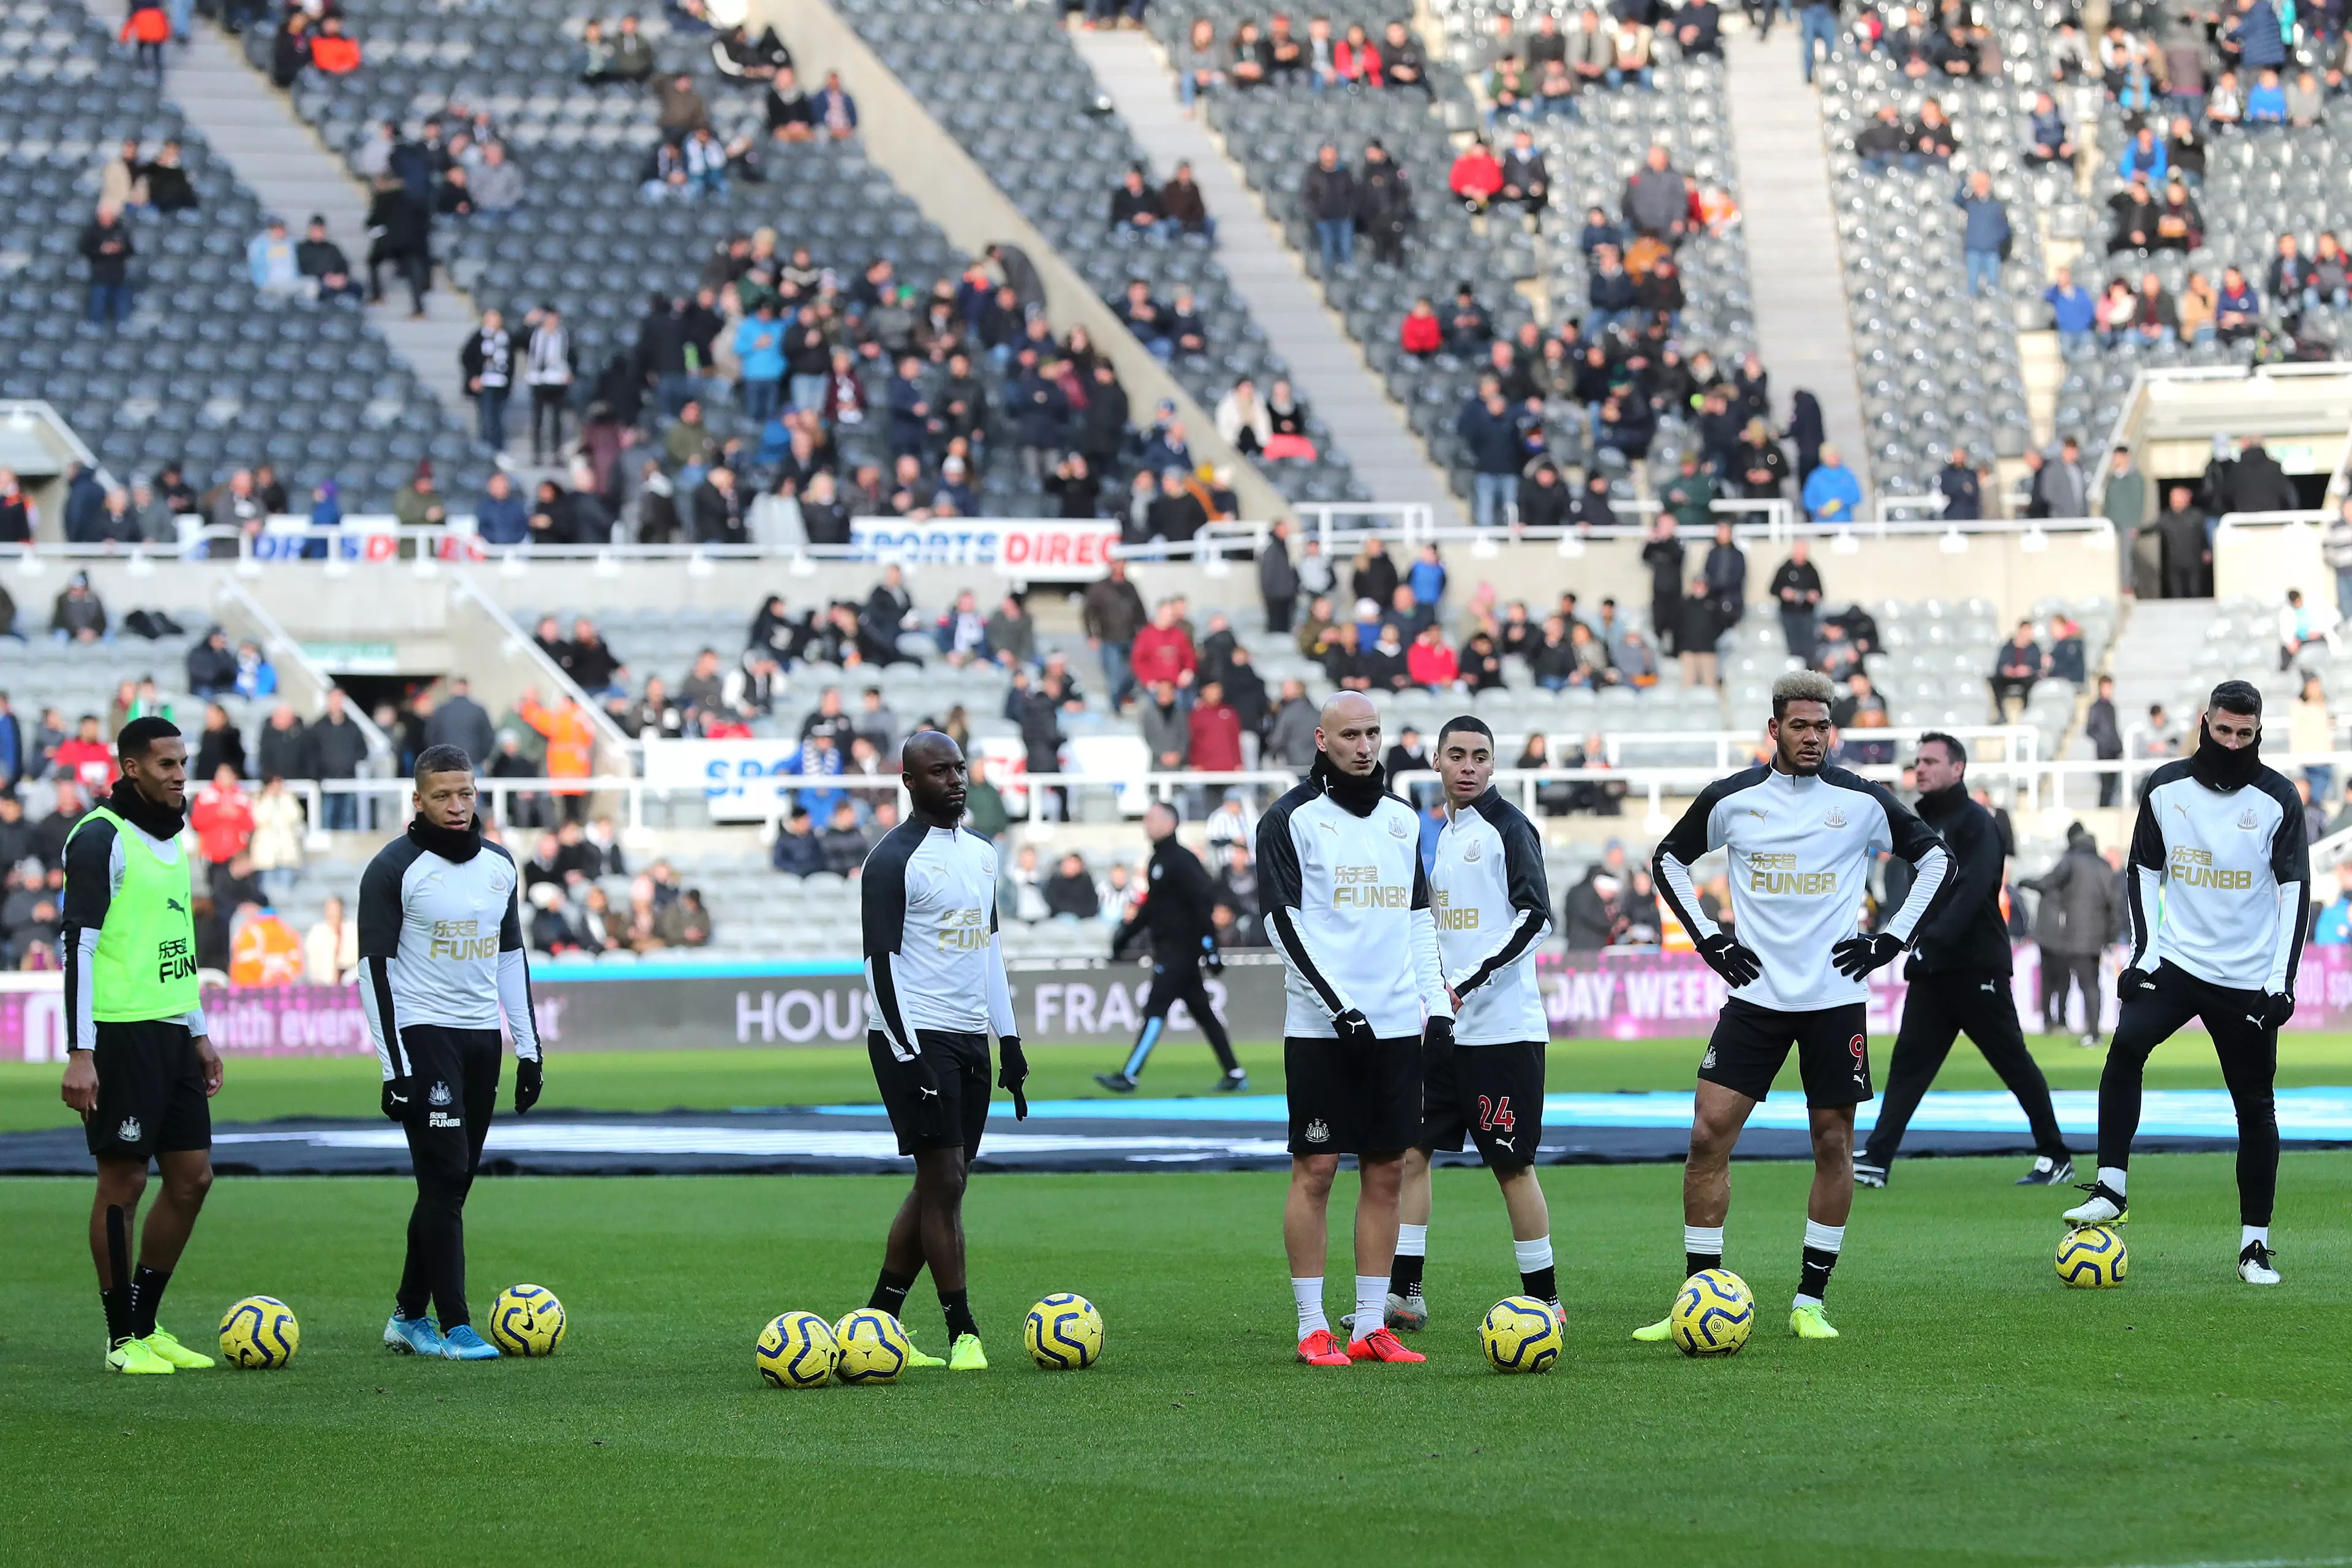
A number of boycotts has resulted in an average attendance of 47,166 - around 5,000 short of the full capacity.
Advert
Southampton and Burnley make up the bottom three as far as capacity percentages go, with both on 91.5% from their home games in 2019/120.
Here is the table in full:
1. West Ham
Capacity: 60,000
Advert
Average: 59,916
Capacity percentage: 99.9%
2 = Chelsea
Capacity: 40,853
Average: 40,567
Capacity percentage: 99.3%
2 = Leicester City
Advert
Capacity: 32,273
Average: 32,046
Capacity percentage: 99.3%
2 = Arsenal
Capacity: 60,704
Average: 60,278
Capacity percentage: 99.3%
5. Norwich
Advert
Capacity: 27,244
Average: 27,037
Capacity percentage: 99.2%
6. Everton
Capacity: 39,571
Average: 39,215
Capacity percentage: 99.1%
7. Brighton
Capacity: 30,666
Average: 30,352
Capacity percentage: 99.0%
8. Manchester City
Capacity: 55,017
Average: 54.386
Capacity percentage: 98.9%
9. Liverpool
Capacity: 54,074
Average: 53,118
Capacity percentage: 98.2%
10. Aston Villa
Capacity: 42,682
Average: 41,703
Capacity percentage: 97.7%
11. Wolves
Capacity: 32,050
Average: 31,287
Capacity percentage: 97.6%
12. Manchester United
Capacity: 74,879
Average: 72,419
Capacity percentage: 96.7%
13. Crystal Palace
Capacity: 26.047
Average: 25.058
Capacity percentage: 96.2%
14. Spurs
Capacity: 62,062
Average: 59,308
Capacity percentage: 95.6%
15. Watford
Capacity: 21,577
Average: 20,593
Capacity percentage: 95.4%
16. Sheffield United
Capacity: 32,702
Average: 30,799
Capacity percentage: 94.2%
17. Bournemouth
Capacity: 11,329
Average: 10,531
Capacity percentage: 93.0%
18 = Burnley
Capacity: 32,384
Average: 29,646
Capacity percentage: 91.5%
18 = Southampton
Capacity: 32,384
Average: 29,646
Capacity percentage: 91.5%
20. Newcastle United
Capacity: 52,338
Average: 47,166
Capacity percentage: 90.1%
Topics: Football News, Football, Premier League